Who Really Controls The Global Battery Industry?
Two companies make more than half the world’s electric-vehicle batteries. The finished cell is only the visible tip of the chain.
Two companies make more than half the world’s electric-vehicle batteries. But the finished cell is only the visible tip of a value chain whose principal chokepoints sit further upstream, and they point overwhelmingly in one direction.
The Visible Tip: Two Firms, Half The Market
Ask who controls the battery market and the intuitive answer is a league table of cell makers. On that measure the picture is stark but familiar. Global installations of electric-vehicle batteries reached about 1,187 GWh in 2025, a rise of nearly 32% on the year, according to the South Korean research firm SNE Research. CATL alone accounted for roughly 39% of that total and remained the only supplier above the 30% mark. BYD followed with about 16%. Between them, the two Chinese firms fitted more than half of every battery installed in a vehicle anywhere in the world.
Behind the leaders, the ranking reinforces the point. LG Energy Solution held third place at around 9%, the strongest non-Chinese position, followed by a mix of Chinese and Korean names: CALB, SK On, Japan’s Panasonic, Gotion, Samsung SDI, Eve Energy and Svolt. Six of the ten largest cell makers are Chinese. The Korean and Japanese incumbents that led the industry a decade ago are now defending shrinking territory as Chinese scale, lower costs and closer ties to global carmakers erode their positions.
Yet the cell is the layer with the most visible brands, and the one where capacity expansion outside China is progressing most rapidly. China still hosts about 85% of the world’s cell-manufacturing capacity, on IEA figures, but committed projects are set to almost quadruple capacity in both the European Union and the United States by 2030, and the first Indian, Indonesian and Moroccan plants have begun to arrive. The name on the cell is the part of the story everyone can see. It is also the part that is changing fastest. In the Ledger’s reading, it is the steps before the gigafactory that tell the more decisive story.
Where Control Really Sits: Refining And Materials
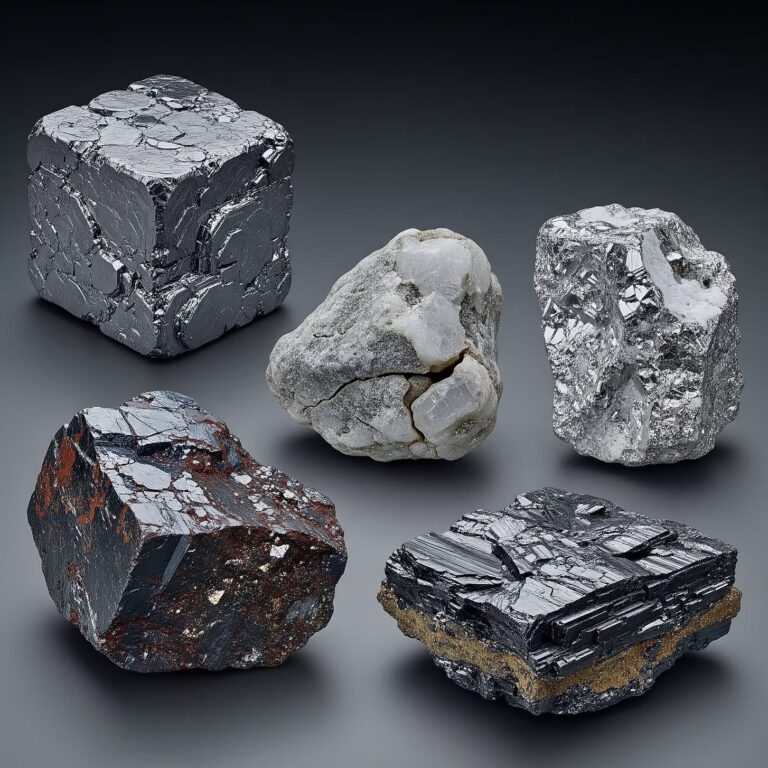
A battery cell is only as sovereign as its inputs, and those inputs run through a processing bottleneck that is far more concentrated than cell-making itself. The IEA’s Global Critical Minerals Outlook 2025 found that the combined share of the top three refining nations for the key energy minerals, copper, lithium, nickel, cobalt, graphite and rare earths, rose from around 82% in 2020 to 86% in 2024. Almost all of that growth came from a single supplier in each material: Indonesia for nickel, and China for cobalt, graphite and rare earths.
The detail beneath the average is sharper still. On the IEA’s 2023 figures, Australia, Chile and China mined about 85% of the world’s lithium, but almost 65% of it was refined in China. Cobalt tells the same story: the Democratic Republic of the Congo produced close to two-thirds of the ore, yet three-quarters of all cobalt refining was handled in China. Graphite, the sole critical mineral in today’s anodes, is more concentrated again, with China responsible for over 90% of refining. Widen the lens to a broader set of 20 energy-related strategic minerals and the IEA identifies China as the leading refiner for 19 of them, at an average market share near 70%.
A metal can be dug up almost anywhere. It becomes a battery only where someone will refine it, and that someone is usually in China. This is the part of the chain where substitution is hardest and where new capacity typically requires long lead times and substantial capital investment. A material can be mined in Australia or the Congo and remain strategically dependent on China, because it must still be converted into battery-grade chemicals, and that conversion overwhelmingly happens in Chinese plants.
The Midstream Chokepoint: Cathodes, Anodes And The Rest
Between refined chemicals and finished cells sit the four components that define a battery’s performance: cathode and anode active materials, electrolytes and separators. This midstream is among the most concentrated layers of the entire chain. Chinese firms hold roughly three-quarters to more than 90% of global capacity across the four, depending on the component and the source. Analysis by Germany’s DGAP, drawing on Fraunhofer ISI data, put the figure at roughly 75% to 85% across all four components as of 2024, while the IEA’s Global EV Outlook 2025 puts China’s share of anode active material production above 90%, and its share of cathode active materials at almost 85%.
The dependency runs deeper than the headline figures suggest, because it reaches inside the supply chains of China’s competitors. Korean and Japanese cell makers, the strongest non-Chinese players, still lean heavily on Chinese cathode and anode inputs; outside China, only Korea and Japan hold sizeable cathode capacity at all. The US Energy Information Administration reported that China exported 58% of the world’s processed battery minerals and 53% of battery-material export trade in 2023. For the fast-growing lithium iron phosphate chemistry, now covering nearly half the electric-car market from under 10% in 2020, the picture is more lopsided again: the IEA notes that China produces about 75% of the world’s purified phosphoric acid, a core LFP input, and 95% of the high-purity manganese sulphate that feeds manganese-rich and sodium-ion chemistries.
The strategic reading is blunt. DGAP, citing McKinsey, projects that on current trends Europe and North America combined would hold only 5% to 10% of global capacity across the four key components by 2030. A cell plant in Poland or Tennessee can be built in a few years. Rebuilding the component base beneath it is the harder, slower task.
Closing The Loop, And The One Diversified Layer
Recycling was meant to be the West’s chance to build a domestic materials source independent of new mining. Here too the centre of gravity has moved east: the IEA reports that roughly two-thirds of the growth in global battery-recycling capacity since 2020 has been in China. The circular economy, for now, is being closed largely inside the same borders that dominate refining and components.
Mining is the exception that proves the rule. Extraction remains comparatively spread out. The top three mining countries’ share of key energy minerals rose more modestly, from 73% in 2020 to 77% in 2024, and lithium in particular has drawn new supply from Argentina and Zimbabwe. Australia leads hard-rock lithium, the Democratic Republic of the Congo dominates cobalt ore, Indonesia has become the nickel powerhouse and Chile anchors the brine-based lithium triangle. The map of who digs the metals out of the ground is genuinely global. The map of who controls the industry is not the same map.
What The Sources Do Not Establish
SNE Research’s figures track batteries installed in vehicles, not total cell output, and they exclude the stationary storage market, so they understate the overall footprint of several makers. The IEA’s component and capacity shares are 2024 figures and its mining and refining splits are drawn from 2023, so they describe recent position rather than this month’s. Refining, component and mining shares are also drawn from different measures, capacity, output and export trade, which do not align precisely; the single percentages quoted here are best read as ranges rather than exact points. The dominance figures say little about quality tiers, where Japanese and Korean firms retain strength in premium separators and high-nickel cathodes that raw volume shares obscure. And all of these are snapshots. Export-control actions and proposals across 2024 and 2025 are still working through the system, and their full effect is not yet visible in the data.
The Ledger
The following is Battery Ledger analysis. The facts above are sourced as cited; the readings drawn from them are our own.
The temptation is to answer “who controls the battery market” with the cell-maker league table, because that is where the recognisable names are. That answer is incomplete. Cell assembly is the layer where brands compete, where capacity is expanding fastest outside China, and where the country’s share is actually projected to fall, from about 85% of manufacturing capacity in 2024 towards two-thirds by 2030 on the IEA’s numbers. Market influence, in the sense that shapes the industry’s options, sits one and two steps upstream, in the conversion of ore into chemicals and the manufacture of the four components. That is where lead times are longest, capital costs highest and alternatives thinnest. A gigafactory can be stood up relatively quickly. The chemistry beneath it cannot.
The clearest evidence that upstream is where the leverage lies came not from a market-share table but from a policy lever. The IEA notes that China has proposed export restrictions on key battery technologies, including LFP cathode production and lithium processing, and that critical-mineral export controls have proliferated since 2023, reaching into the processing technologies themselves rather than just raw and refined materials. A country restricts what it controls. That the restrictions have reached into refining and cathode know-how, not just finished cells, is the industry pointing to where its principal chokepoint arguably lies. The IEA’s own modelling underlines the stakes: it estimates that a sustained supply shock in battery metals could lift average pack prices by as much as 40% to 50%. The companies shaping the battery industry, then, are not only the ones whose logos appear on the cell. They are the refiners, the cathode and anode makers and the recyclers whose names most drivers will never see, and whose position is, for now, the most entrenched of all.
Key Takeaways
- CATL and BYD together supplied roughly 55% of the electric-vehicle batteries installed worldwide in 2025, and six of the ten largest cell makers are Chinese, according to SNE Research.
- Cell assembly is the most visible layer of the industry, but it is not where market power concentrates most tightly. Refining, components and recycling are more heavily dominated by China still.
- The top three refining nations now account for 86% of the world’s key energy minerals, up from about 82% in 2020, with China the leading refiner for 19 of the 20 strategic minerals the IEA tracks.
- Chinese firms hold roughly three-quarters to more than 90% of global capacity across the four principal battery components, depending on the component and source.
- Mining is the one comparatively diversified layer of the chain, spread across Australia, the Democratic Republic of the Congo, Indonesia and Chile, which is why processing, not extraction, is where the leverage increasingly lies.
Key Figures
- SNE Research, full-year 2025 global EV battery installation data (via CnEVPost and electrive)
- International Energy Agency, Global Critical Minerals Outlook 2025, executive summary and overview of key minerals (iea.org)
- International Energy Agency, Global EV Outlook 2025, electric vehicle batteries chapter (iea.org)
- US Energy Information Administration, “China dominates global trade of battery minerals” (eia.gov)
- DGAP, Memo No. 54, December 2025, citing Fraunhofer ISI and McKinsey & Company (dgap.org)
Read next
All insights →

 Newest on The RegisterDr Francisco TrinidadFormer Director of Battery Technology, Exide · Alpha Beta SocietyRead the profile →